Mikala's Maps

Monday, April 15, 2013
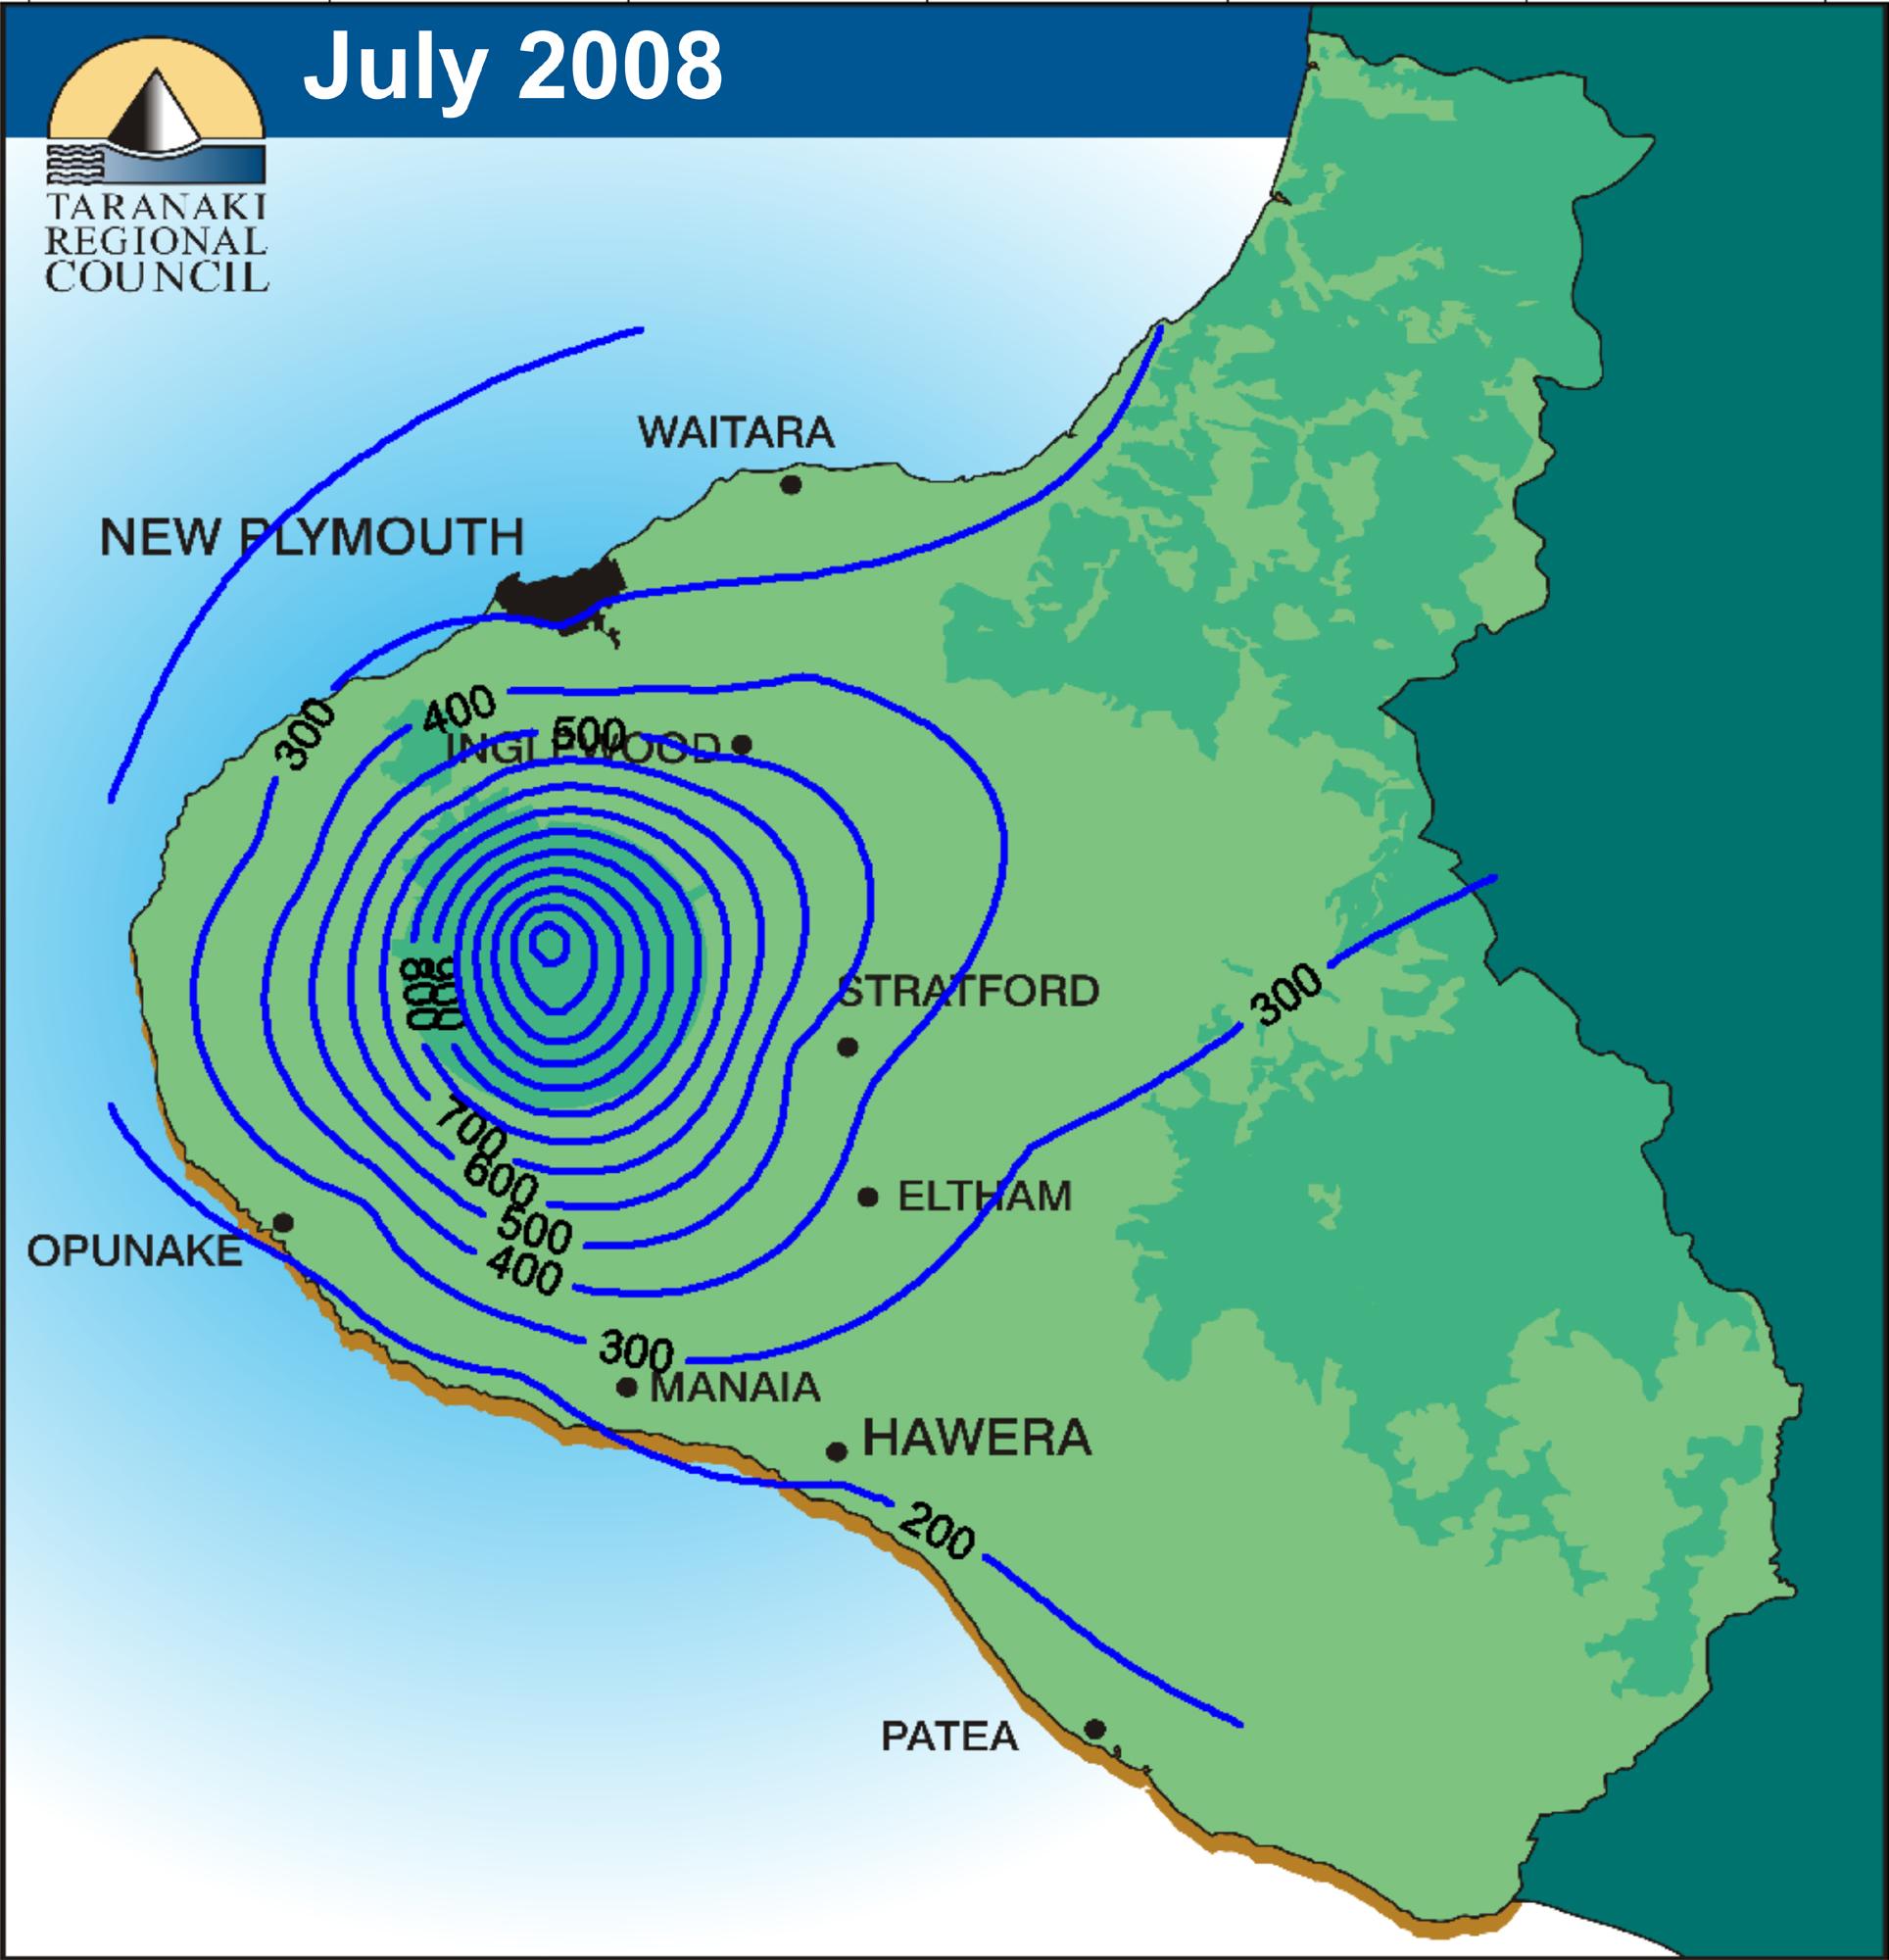
Isohyets

http://www.scoop.co.nz/stories/AK0808/S00090.htm

Isohyets are lines on a map connecting areas that received the same amount of rainfall. This is a map of part of New Zealand with isohyets showing how much rain the area received in 2008.

Posted by mrandich at 6:58 AM
Email ThisBlogThis!Share to XShare to FacebookShare to Pinterest

No comments:

Post a Comment

Newer Post Older Post Home
Subscribe to: Post Comments (Atom)

Blog Archive

  • ▼  2013 (50)
    • ▼  April (50)
      • Box Plot
      • Triangular Plot
      • Star Plot
      • Stem and Leaf Plot
      • Histogram
      • Windrose
      • Climograph
      • Population Profile
      • Scatterplot
      • Index Value Plot
      • Accumulative line graph or Lorenz curve
      • Bilateral Graph
      • Nominal Area Choropleth Map
      • Unstandardized Choropleth Map
      • Standardized Choropleth Map
      • Univariate Choropleth Map
      • Bivariate Choropleth Map
      • Unclassed Choropleth Map
      • Classed Choropleth Map
      • Range graded proportional circle map
      • Continuously Variable Proportional Circle Map
      • DOQQ
      • DEM
      • DLG Map
      • DRG map
      • Isopleth Map
      • Isopachs
      • Isohyets
      • Isotachs
      • Isobars
      • LIDAR
      • Doppler Radar
      • Black and White Aerial Photo
      • Infrared Aerial Photograph
      • Cartographic Animation
      • Statistical Map
      • Cartogram
      • Flow Map
      • Isoline Map
      • Proportional Circle Map
      • Choropleth Map
      • Dot Distribution Map
      • Propaganda Map
      • Hypsometric Map
      • PLSS Map
      • Cadastral Map
      • Thematic Map
      • Topographic Map
      • Planimetric Map
      • Mental Map

About Me

mrandich
View my complete profile
Picture Window theme. Powered by Blogger.