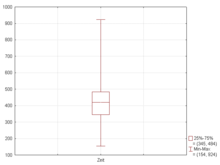
A box plot displays the distribution of data through five characteristics of the data set: smallest observation, lower quartile, median, upper quartile, and largest observation.
A triangle plot is a graphic representation used to show how three variables sum up to a whole. This example of a triangle plot shows ways tsunami waves from three modeled sources can arrive at a coastal site.
A star blot is a graphic tool used for displaying multivariate data, with each point of the star representing a single observation. This star plot of the success of different MER IDD designs with respect to 7 different parameters.
A stem and leaf plot is a visual display of numerical data that makes it easy to find the mean, median, and mode. The first digits of the number are placed on the left side, and the last digit of the number are placed on the right side.
A histogram is a graph where the height of each bar is proportional to the frequency density of the interval. This is a histogram that shows scores on an exam and the number of students who received that score.
A windrose is a graphic used to display both wind speed and direction for a particular location. This is a windrose from LaGuardia airport in New York, New York.
A climograph is a graph that displays the basic climatic parameters for a given location, such as average temperature and precipitation. This is an example of a climograph because it displays the average monthly precipitation and temperature for Calcutta.


